Experimenting with technical indicators using Python and backtesting
Introduction
In this report, we present an experiment with technical indicators using the BatchBacktesting project available on GitHub at the following link: BatchBacktesting.
Installing Dependencies
To get started, install the necessary libraries:
!pip install numpy httpx richp
Importing Modules
Here are the modules to import for the script:
import pandas as pd
import numpy as np
from datetime import datetime
import httpx
import concurrent.futures
import glob
import warnings
from rich.progress import track
warnings.filterwarnings(“ignore”)
API Configuration
Replace the placeholders FMP_API_KEY and BINANCE_API_KEY with your actual API keys to access the data from the respective services.
BASE_URL_FMP = “https://financialmodelingprep.com/api/v3"
BASE_URL_BINANCE = “https://fapi.binance.com/fapi/v1/"
FMP_API_KEY = “YOUR_FMP_API_KEY”
BINANCE_API_KEY = “YOUR_BINANCE_API_KEY”
API Request Functions
The following functions allow you to make API requests to different endpoints and retrieve historical price data for cryptocurrencies and stocks.
def make_api_request(api_endpoint, params):
with httpx.Client() as client:
response = client.get(api_endpoint, params=params)
if response.status_code == 200:
return response.json()
print(“Error: Failed to retrieve data from API”)
return None
def get_historical_price_full_crypto(symbol):
api_endpoint = f”{BASE_URL_FMP}/historical-price-full/crypto/{symbol}”
params = {“apikey”: FMP_API_KEY}
return make_api_request(api_endpoint, params)
def get_historical_price_full_stock(symbol):
api_endpoint = f"{BASE_URL_FMP}/historical-price-full/{symbol}"
params = {“apikey”: FMP_API_KEY}
return make_api_request(api_endpoint, params)
def get_SP500():
api_endpoint = “https://en.wikipedia.org/wiki/List_of_S%26P_500_companies”
data = pd.read_html(api_endpoint)
return list(data[0][‘Symbol’])
def get_all_crypto():
return [
“BTCUSD”, “ETHUSD”, “LTCUSD”, “BCHUSD”, “XRPUSD”, “EOSUSD”,
“XLMUSD”, “TRXUSD”, “ETCUSD”, “DASHUSD”, “ZECUSD”, “XTZUSD”,
“XMRUSD”, “ADAUSD”, “NEOUSD”, “XEMUSD”, “VETUSD”, “DOGEUSD”,
“OMGUSD”, “ZRXUSD”, “BATUSD”, “USDTUSD”, “LINKUSD”, “BTTUSD”,
“BNBUSD”, “ONTUSD”, “QTUMUSD”, “ALGOUSD”, “ZILUSD”, “ICXUSD”,
“KNCUSD”, “ZENUSD”, “THETAUSD”, “IOSTUSD”, “ATOMUSD”, “MKRUSD”,
“COMPUSD”, “YFIUSD”, “SUSHIUSD”, “SNXUSD”, “UMAUSD”, “BALUSD”,
“AAVEUSD”, “UNIUSD”, “RENBTCUSD”, “RENUSD”, “CRVUSD”, “SXPUSD”,
“KSMUSD”, “OXTUSD”, “DGBUSD”, “LRCUSD”, “WAVESUSD”, “NMRUSD”,
“STORJUSD”, “KAVAUSD”, “RLCUSD”, “BANDUSD”, “SCUSD”, “ENJUSD”
]
def get_financial_statements_lists():
api_endpoint = f"{BASE_URL_FMP}/financial-statement-symbol-lists"
params = {“apikey”: FMP_API_KEY}
return make_api_request(api_endpoint, params)
Implementing the EMA Strategy
The EMA (Exponential Moving Average) is a type of moving average that places a greater weight and significance on the most recent data points. The EMA reacts more quickly to recent price changes than the simple moving average (SMA), which assigns equal weight to all observations in the period.
class EMA(Strategy):
n1 = 20
n2 = 80
def init(self):
    close = self.data.Close
    self.ema20 = self.I(taPanda.ema, close.s, self.n1)
    self.ema80 = self.I(taPanda.ema, close.s, self.n2)

def next(self):
    price = self.data.Close
    if crossover(self.ema20, self.ema80):
        self.position.close()
        self.buy(sl=0.90 \* price, tp=1.25 \* price)
    elif crossover(self.ema80, self.ema20):
        self.position.close()
        self.sell(sl=1.10 \* price, tp=0.75 \* price)
In this strategy:
ema20andema80are calculated for a given stock or cryptocurrency.- A buy signal is generated when
ema20crosses aboveema80. - A sell signal is generated when
ema80crosses aboveema20. - Stop loss (
sl) and take profit (tp) levels are set to limit potential losses and secure gains.
Implementing the MACD Strategy
The MACD (Moving Average Convergence Divergence) is a trend-following momentum indicator that shows the relationship between two moving averages of a security’s price. It is calculated by subtracting the 26-period EMA from the 12-period EMA. The result is the MACD line. A nine-day EMA of the MACD called the “signal line” is then plotted on top of the MACD line, which can function as a trigger for buy and sell signals.
class MACD(Strategy):
short_period = 12
long_period = 26
signal_period = 9
def init(self):
    close = self.data.Close
    self.macd = self.I(taPanda.macd, close.s, self.short\_period, self.long\_period, self.signal\_period)

def next(self):
    macd\_line = self.macd.macd
    signal\_line = self.macd.signal
    if crossover(macd\_line, signal\_line):
        self.position.close()
        self.buy()
    elif crossover(signal\_line, macd\_line):
        self.position.close()
        self.sell()
In this strategy:
macd_lineandsignal_lineare calculated using short-term (12-period) and long-term (26-period) EMAs.- A buy signal is generated when the
macd_linecrosses above thesignal_line. - A sell signal is generated when the
signal_linecrosses above themacd_line.
Running Backtests
The following functions allow you to process instruments and run backtests with specified strategies.
def run_backtests_strategies(instruments, strategies):
strategies = [x for x in STRATEGIES if x.__name__ in strategies]
outputs = []
with concurrent.futures.ThreadPoolExecutor() as executor:
futures = []
for strategy in strategies:
future = executor.submit(run_backtests, instruments, strategy, 4)
futures.append(future)
for future in concurrent.futures.as_completed(futures):
outputs.extend(future.result())
return outputs
def check_crypto(instrument):
return instrument in get_all_crypto()
def check_stock(instrument):
return instrument not in get_financial_statements_lists()
def process_instrument(instrument, strategy):
try:
if check_crypto(instrument):
data = get_historical_price_full_crypto(instrument)
else:
data = get_historical_price_full_stock(instrument)
if data is None or “historical” not in data:
print(f"Error processing {instrument}: No data")
return None
data = clean_data(data)
bt = Backtest(data, strategy=strategy, cash=100000, commission=0.002, exclusive_orders=True)
output = bt.run()
output = process_output(output, instrument, strategy)
return output, bt
except Exception as e:
print(f"Error processing {instrument}: {str(e)}")
return None
def clean_data(data):
data = data[“historical”]
data = pd.DataFrame(data)
data.columns = [x.title() for x in data.columns]
data = data.drop([“Adjclose”, “Unadjustedvolume”, “Change”, “Changepercent”, “Vwap”, “Label”, “Changeovertime”], axis=1)
data[“Date”] = pd.to_datetime(data[“Date”])
data.set_index(“Date”, inplace=True)
data = data.iloc[::-1]
return data
def process_output(output, instrument, strategy, in_row=True):
if in_row:
output = pd.DataFrame(output).T
output[“Instrument”] = instrument
output[“Strategy”] = strategy.__name__
output.pop("_strategy")
return output
def save_output(output, output_dir, instrument, start, end):
print(f"Saving output for {instrument}")
fileNameOutput = f"{output_dir}/{instrument}-{start}-{end}.csv"
output.to_csv(fileNameOutput)
def plot_results(bt, output_dir, instrument, start, end):
print(f"Saving chart for {instrument}")
fileNameChart = f"{output_dir}/{instrument}-{start}-{end}.html"
bt.plot(filename=fileNameChart, open_browser=False)
def run_backtests(instruments, strategy, num_threads=4, generate_plots=False):
outputs = []
output_dir = f"output/raw/{strategy.__name__}"
output_dir_charts = f"output/charts/{strategy.__name__}"
if not os.path.exists(output_dir):
os.makedirs(output_dir)
if not os.path.exists(output_dir_charts):
os.makedirs(output_dir_charts)
with concurrent.futures.ThreadPoolExecutor(max_workers=num_threads) as executor:
future_to_instrument = {executor.submit(process_instrument, instrument, strategy): instrument for instrument in instruments}
for future in concurrent.futures.as_completed(future_to_instrument):
instrument = future_to_instrument[future]
output = future.result()
if output is not None:
outputs.append(output[0])
save_output(output[0], output_dir, instrument, output[0][“Start”].to_string().strip().split()[1], output[0][“End”].to_string().strip().split()[1])
if generate_plots:
plot_results(output[1], output_dir_charts, instrument, output[0][“Start”].to_string().strip().split()[1], output[0][“End”].to_string().strip().split()[1])
data_frame = pd.concat(outputs)
start = data_frame[“Start”].to_string().strip().split()[1]
end = data_frame[“End”].to_string().strip().split()[1]
fileNameOutput = f"output/{strategy.__name__}-{start}-{end}.csv"
data_frame.to_csv(fileNameOutput)
return data_frame
Executing the Scripts
To execute the backtests, use the following functions:
tickers = get_SP500()
run_backtests(tickers, strategy=EMA, num_threads=12, generate_plots=True)
run_backtests(tickers, strategy=MACD, num_threads=12, generate_plots=True)
ticker = get_all_crypto()
run_backtests(ticker, strategy=EMA, num_threads=12, generate_plots=True)
run_backtests(ticker, strategy=MACD, num_threads=12, generate_plots=True)
The link you shared corresponds to the output directory of the BatchBacktesting project on GitHub: BatchBacktesting Output Directory. However, it appears that this directory does not contain pre-calculated results. It is likely that the project authors chose not to include test results in the GitHub repository to avoid cluttering the repository with user-specific data.
Get Antoine Boucher’s stories in your inbox
To obtain calculated values for your own tests, you will need to run the script locally on your machine with your chosen parameters and strategies. After executing the script, the results will be saved in the output directory of your local project.
Here is an example output link for reference: EMA Chart for AAPL.
Results Analysis
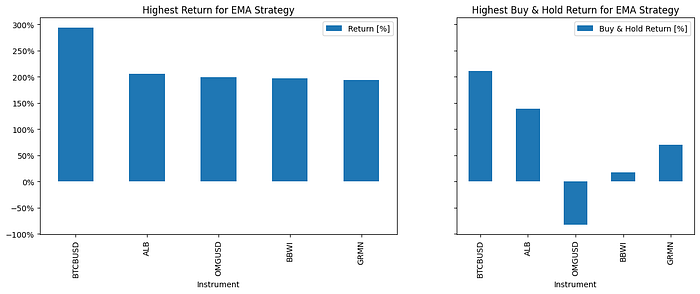
Here is an example of the results obtained for the instruments with the highest and lowest returns for EMA:
- Top 5 instruments with the highest returns:
- BTCBUSD: 293.78%
- ALB: 205.97%
- OMGUSD: 199.62%
- BBWI: 196.82%
- GRMN: 193.47%
- Top 5 instruments with the lowest returns:
- BTTBUSD: -99.93%
- UAL: -82.63%
- NCLH: -81.51%
- LNC: -78.02%
- CHRW: -76.38%
Press enter or click to view image in full size
Conclusion
In conclusion, the BatchBacktesting project offers a flexible and powerful approach for testing and analyzing the performance of technical indicators on stock and cryptocurrency markets. The provided functions allow easy integration with financial services APIs and straightforward data manipulation. The experimental results can be used to develop and refine algorithmic trading strategies based on observed performance.
Originally published on Medium.